


Triple top and triple bottom patterns are uncommon but potent formations that indicate a trend reversal. The triple bottom may suggest the beginning of a new bullish trend, whilst the triple top may indicate a near-term corrective. Nonetheless, it is rare to identify a flawless triple top or bottom pattern in which the horizontal resistance and neckline are parallel. The potency of these patterns derives from their rarity.
Once a triple pattern has been identified, it can be simply exploited as a source of technical analysis in the formation of a trading strategy. We will cover triple bottom chart patterns and how to construct trade patterns based on their identification.
Table of Contents
What Is A Triple Bottom Pattern?
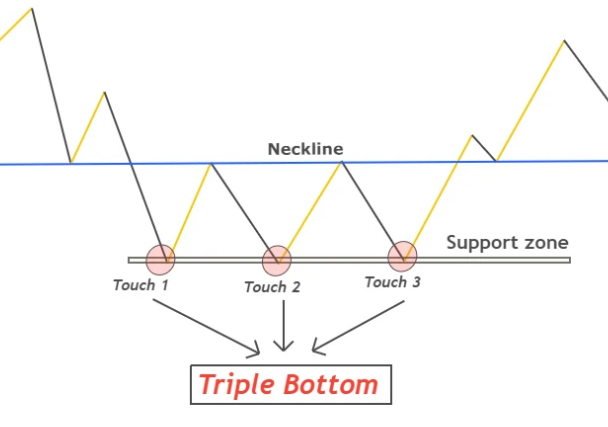
In technical analysis, three consecutive bottoms followed by a resistance neckline constitute the triple bottom pattern, which is a bullish reversal chart pattern that occurs after a downward trend. The breakout is frequently followed by a trend reversal and the beginning of a bullish trend.
The triple bottom pattern consists of three unsuccessful efforts to break the support line at the same price level, followed by a breakout over the resistance neckline. When this occurs, the breakout point signals a bullish trend, taking a long position.
The general structure of this technical analysis pattern is similar to that of other reversal patterns, such as the double bottom and head and shoulders. Clearly, it operates similarly to the triple top pattern, which advances in the other direction and is, therefore, a bearish reversal chart pattern.
Triple Bottom Components
- Three troughs
Equally spaced, they are also known as the three lows and serve to denote key spots on the pattern. It is essential to recognize that the lows do not need to be identical, but they must fall within the same range.
- Volume
Typically, volume decreases when a pattern develops, and there are times when it increases significantly towards the lows. The volume will increase near the resistance breakout when the third low is reached.
- Price target
The distance between the lows and the resistance break can be added to the resistance break by a trader. If the pattern’s evolution is prolonged, the eventual breakout will occur.
- Resistance break
This is the pattern’s highest point.
- Broken resistance
Broken resistance = possible support.
What Does The Pattern Reveal?
The triple bottom pattern is a forceful reversal pattern, and with extra confirmation from your volume indicator, this pattern will not only suggest a possible trend reversal but also keep you on the right side of price movement.
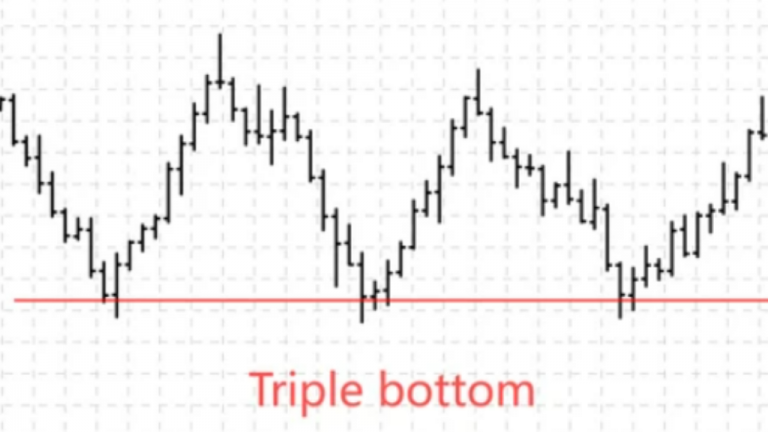
As implied by its name, the triple bottom comprises three consecutive lows written at or around the same level. In order for this chart pattern to form and be effective, the price movement must have a distinct downturn.
The sellers drive the price lower to test the horizontal support for the first time, but they are met with strong buyer resistance. The market action recovers to the upside as sellers take a breather prior to the second effort.
As the sellers, who are still in control of the price action, have now failed on their second try, this level is now extremely significant.
The price should generally recover to levels comparable to the most recent rebound. Given the strength of the downtrend, the sellers again attempt to break the purchasers’ determination by pushing the price action lower, but without much success.
Finally, the sellers give up, and the purchasers seize control of the price movement, this time extending the comeback far higher and eventually erasing most or all of the prior losses.
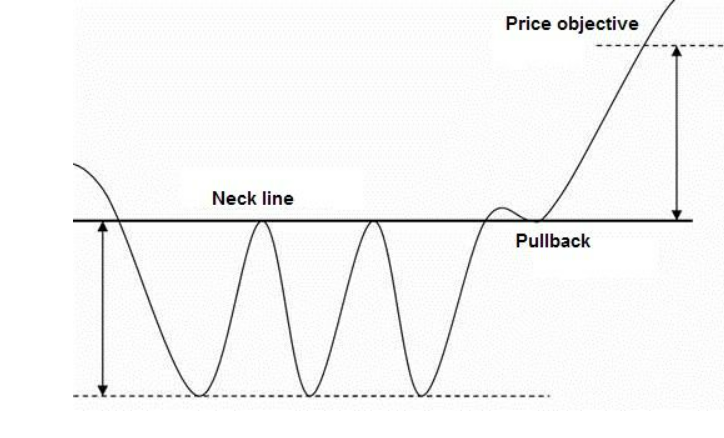
The horizontal support depicted by the blue line in the graphic above denied the bears’ attempt to prolong the decline. A neckline (the red line) connects the peaks of two rebounds in the upper region.
The neckline is undoubtedly the most crucial feature of the triple bottom pattern, as its break to the upside activates the pattern and enables us to calculate the stop loss and take profit levels. Therefore, three essential characteristics of the triple bottom chart pattern are:
- A downtrend is when the price of the security must trade lower;
- Horizontal support – A trendline that connects three essentially equal lows
- A neckline whose break indicates formation activation.
How Can You Recognize A Triple Bottom Pattern?
It is quite simple to recognize a triple bottom pattern. Initially, you must identify a chart in which the price is falling, and it cannot form during periods of upswing.
Second, the three levels of assistance must be approximately equivalent. As you shall see, these levels are not always completely horizontal. But they must be somewhat comparable. It is also important to note that the lower edge of the triple-bottom pattern might be sloped.
Thirdly, volume is essential to the creation of this pattern. Typically, the volume will increase as the price approaches its lowest point.
Also, keep in mind that the resistance break frequently validates the triple bottom pattern.
Finally, the price objective is typically estimated by considering the support level and the upper boundary. In some instances, the price will increase proportionally.
The triple bottom pattern should also be interpreted as positive when the price climbs over the resistance level.
What Occurs Following A Triple Bottom Pattern?
After the three low points of a triple bottom have formed, a bullish reversal to new market highs is anticipated. First, locate the peak of the triple bottom pattern to confirm the upward breakout.
Placing vertical lines at the pattern’s first and third lowest points is the simplest approach to identifying the high point. Find the highest pricing point (or peak) between these two vertical lines. The highest price among the three bottoms in the following graph is $42,396. Mark this high point with a right-extending horizontal line.
The sustained break above this price level will signal to the bullish trader that a turnaround is underway and that prices are likely to rise further. This confirmation is not failsafe, but traders can rely on its reliability to make trades with a higher possibility of success.
The evidence for a bullish break can be bolstered by additional confirming factors, such as growing volume on the uptrend or extending ranges of bullish candles.
These elements are not necessarily required for a bullish breakout to be successful, however, their existence increases the possibility that the breakout will be sustained.
What Is The Significance of The Triple Bottom Pattern?
As a stock trader, you understand the significance of a triple-bottom pattern. Although few traders want to discuss this dangerous trade, it pays off pretty handsomely provided the setup is identified correctly before the breakout.
The triple bottom pattern is significant because it provides additional evidence that the market is trending in a single direction. This pattern indicates the continuation of market movement with high precision.
A triple bottom is a reversal pattern indicating a change in the current market or trend direction. There are only three truly significant reversal patterns, and this one is one of them (along with a double bottom and head and shoulders, which are both reversal patterns as well). This pattern consists of three distinct troughs, typically at identical lows, and suggests an area of recurring demand.
There is a reason the triple bottom pattern occurs. As a result, investors may feel more confident that the market is poised to rise again and will not remain flat for too much longer. It often signifies the final retracement in a bear market and the beginning of an intermediate-term trend reversal. In other words, the stock should have a sustained uptrend in the wake of this chart pattern.
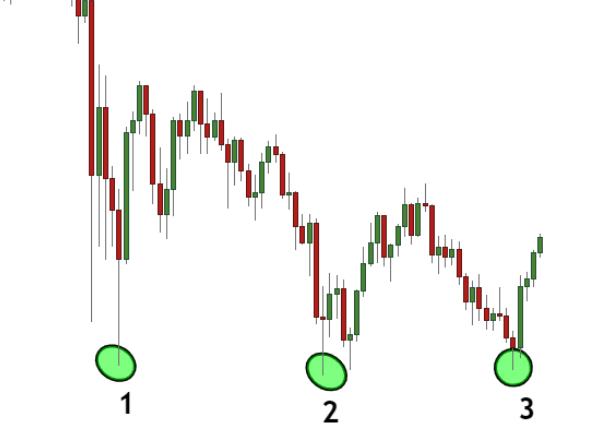
Many options traders view the triple bottom pattern as an excellent indicator of support. This pattern in a market with a downward trend resembles the letter “W” with three equal lows. The initial low happened at the beginning of the downtrend, and the second and third lows followed closely.
The pattern can be employed as a reversal or continuation indicator, but the reversal is its most common pattern.
Pros And Cons of A Triple Bottom
Pros of A Triple Bottom
The triple bottom pattern is one of the most reliable methods of technical analysis. Here are a few of the benefits:
The triple bottom pattern is an excellent trading indication that has benefited many traders with big market returns for decades. It can be a highly successful tool for technical traders with experience. The pattern happens when there is a reversal pattern in a downtrend; the stock breaks out to new highs and then returns to its previous low, creating a triple bottom reversal pattern.
Triple Bottom Patterns are the most advantageous chart pattern in forex trading and apply to all time frames and currency pairs. The fundamental principle is to wait for three price hits of a support or resistance level. This presentation will demonstrate how to recognize these patterns, trade them, and use a trailing stop to minimize your risk.
The Triple Bottom pattern is among the most effective chart patterns, and it can indicate market bottoms, peaks, and significant reversals. The Triple Bottom pattern can serve as an entry point, stop loss point, or exit point for pattern traders.
The benefit of a triple bottom is that it gives the opportunity for rapid gains.
Cons of A Triple Bottom
As you are dealing with probability when trading chart patterns, there is always some uncertainty. As with most patterns, it is easiest to detect the triple bottom after the trading opportunity has passed. The failure of a double bottom can result in the formation of a triple bottom, and the triple bottom and head-and-shoulders pattern can, by definition, be identical.
However, the most frequently noted disadvantage of a triple bottom is that it does not offer a favorable risk-to-reward ratio due to the location of the stop loss and target. To increase the profit potential, traders may decide to place their stop loss within the pattern and then trail it higher as the breakout happens. This increases the likelihood of being stopped out for a little lost inside the range.
Is The Quantity in A Triple Bottom Significant?
Typically, the quantity in a triple bottom appears to decrease as the pattern forms. On each effective low, the proportion appears optimal. The quantity then increases as rates surpass the verification point and enter a new increasing trend.
A triple bottom should not be discounted if the price does not exhibit this pattern. The formation of the structure can take several months, during which time the quantity can be uneven and unpredictable. The amount should be more than the days preceding the lows at the lows.
The Difference Between A Triple Bottom And A Triple Top
Technical analysis employs a variety of different types of patterns. The triple bottom pattern seeks for a stock to break out from a support level that has worked as a “floor” or “base” for the stock. In the opposite direction, though, a broken level of resistance might operate as the lowest price floor, generating a top pattern. While these phrases are used interchangeably in the industry, there are important distinctions between them that should be considered before investing in either type of formation.
There is a Triple Bottom pattern when three or more consecutive troughs form a triangle. It is simply created by connecting the troughs with a dashed line, similar to how a chart’s successive peaks are connected. Double Bottom and Triple Bottom patterns are both termed Reversal Patterns and depict alternating periods of profits and losses that develop over time, as opposed to on a single day.
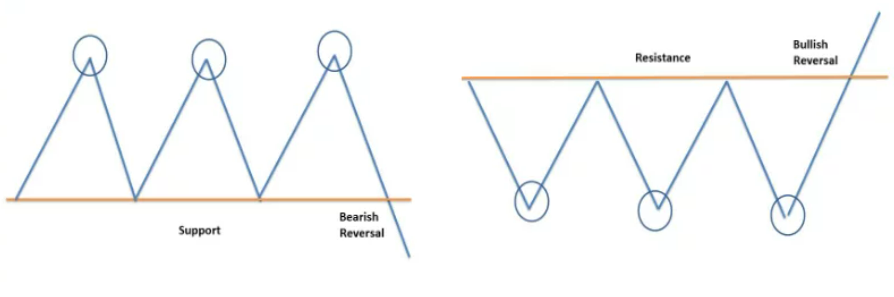
A triple bottom is an indication of a negative market reversal, whereas a triple top is optimistic, and both indicate the conclusion of an ongoing trend.
Triple tops and bottoms are difficult to comprehend, and it is not sufficient to know how the setup appears. You must comprehend why it is extremely challenging for prices to move farther up or down after the construction of the pattern.
How to Trade The Triple Bottom Stock Chart Pattern?
After the neckline has broken, the triple bottom pattern is complete. After the breakout of the neckline, we will enter a trade and update our stop loss and take profit levels.
Entry
There are two alternatives accessible in the entry.
The initial step is to place an order shortly after the breakout of the neckline.
Second, the order on the neckline retest must be opened.
Opening an order on retest is the safest trading strategy and offers a favorable risk-to-reward ratio.
Stop loss
Stop loss should be placed below the low of the triple bottom pattern.
Take profit
Calculate the average distance between the support and resistance levels and position the profit level above the neckline.
Strategies For Trading The Triple Bottom Pattern
As previously said, the triple bottom pattern is an indicator of a bullish trend reversal. This means there is no ambiguity on how to trade this pattern, and a trader will essentially be searching for the optimal entry moment to buy the asset. As soon as the asset price breaks above the resistance level known as the “neckline,” this action is taken.
To use this chart pattern effectively, you must also combine additional technical indicators to corroborate the reversal and assist you in determining the ideal price at which to place a stop-loss order.
There will be a demonstration of how to use the Moving Average Convergence Divergence (MACD) and Fibonacci retracement levels in conjunction with triple bottom patterns, both of which are useful technical indicators in their own right.
Moving Average Convergence Divergence (MACD) and Triple Bottom Chart Patterns
MACD is a well-known momentum indicator used to identify trend reversals. When adding the MACD indicator to a price chart with a triple bottom pattern, you are essentially searching for a crossover at the exact point where the price breaches the resistance neckline.
Using the same chart as in the preceding illustration, we added the MACD to obtain an additional indicator for a trend reversal. As shown, the MACD crossover happens when the price reaches the resistance line, confirming the trend reversal.
Fibonacci Retracement Levels and Triple Bottom Chart Patterns
I believe Fibonacci retracement levels are among my favorite technical indicators regardless of the pattern chosen. Why? Because Fibonacci retracement levels are so well-known and frequently utilized by traders. Consequently, these Fibonacci price levels represent important support and resistance zones.
Consider an example to illustrate how the integration of Fibonacci retracement levels with the triple bottom pattern works.
As seen in the EUR/JPY 30-minute chart above, the price recovers after three unsuccessful attempts to breach the resistance line. The beauty of this situation is that the break happens precisely at the 23.6% Fibonacci level, confirming the breakout.
In this instance, the stop loss might be placed at the 0% Fibonacci level, and the take profit may be placed at the 50% Fibonacci level or above.
Conclusion
Although patterns provide vital information regarding future price movements, chart patterns should not be relied upon solely. Numerous other variables influence price fluctuations. For instance, the double bottom pattern sometimes fails and transforms into a triple bottom chart before the price breaks out above the resistance line. Similarly, the triple bottom pattern might fail in certain cases, and traders should consider additional data such as volumes, prices, and spacing before entering positions.