


Learning and identifying stock market chart patterns is a favorite pastime among day traders of all skill levels. The ABCD pattern is one of the most rational and consistently recurring trading patterns accessible. The ABCD chart pattern is an intraday pattern, and it occurs when a stock jumps significantly, pulls back, grinds upwards, and breaks out to a new daily high.
Table of Contents
What Is A Stock ABCD Pattern?
The ABCD pattern is a chart pattern used to discover probable long trade setups in the chat. This pattern is typically used intraday but can also be adapted to other timeframes.
The pattern is distinguished by an initial spike (A) in which the stock price achieves its daily high. This increase is inevitably followed by a healthy reversal when profit takers sell their shares. When purchasers prevail over sellers, an intraday low is formed (B). On the next decline, we hope the stock will demonstrate strength by establishing a higher bottom (above point B). Once this higher low is established (C), we plan our trade with a risk level of B. We are anticipating that the stock will break above point A for an intraday breakout, and we are managing our risk accordingly. Once the stock breaks above point A, the trade plan is deemed successful, and profit-taking at point D is considered.
Why Is The ABCD Pattern Significant?
ABCD pattern trading is the easiest to recognize of all market patterns and serves as the foundation for subsequent patterns. This is because it derives from the Fibonacci sequence, which includes dividing one number by another as part of a pattern.
In the case of ABCD pattern trading, the important Fibonacci ratio of 61.8% is sought by traders. Ideally, point C will be 61.8% of point A. If this is the case, traders can utilize the Fibonacci sequence to determine when to enter or leave their positions by plotting the value of D. Sourcian is a dedicated platform for the recommendation of the best manufacturers. Your sourcing journey starts right here at sourcian.

Recognizing an ABCD pattern is the first step in recognizing other patterns, such as a flag pattern or a rising/falling wedge. A convergence of patterns atop the ABCD pattern is typically indicative of a stock’s predictable behavior. This offers traders the confidence to enter or exit a position at higher prices.
When Should The ABCD Pattern Be Used?
Due to its simplicity and the fact that the majority of other patterns are built on it, the ABCD pattern is an excellent one to utilize when beginning trading. It is also an “afternoon pattern,” which means that it begins later in the day. The entry point for investments typically falls inside the 2 p.m. window, which is thought to be between 1 p.m. and 3:30 p.m. Consequently, part-time traders should also be on the lookout for this pattern, as it occurs over lunch.
When Is An ABCD Pattern Bullish?
The investor will try to purchase at point D if the ABCD pattern is bullish. The pattern can be described in the following manner:
A: Point A is at an all-time high.
B: Point B is at an all-time low. Even if the stock price may climb or drop throughout the AB leg, there cannot be a point of value above A or below B. In order to comply with the ABCD pattern, A and B must be the highest and lowest points of the AB leg, respectively.

C: Point C must be below point A, but not below point B. It is referred to as the second low.
D: Point D must be below point B. This is a new low point for the price. As with the AB leg, and for the same reasons, the CD leg cannot have points higher than C or lower than D. At point B; the investor should aim for a minimum profit target.
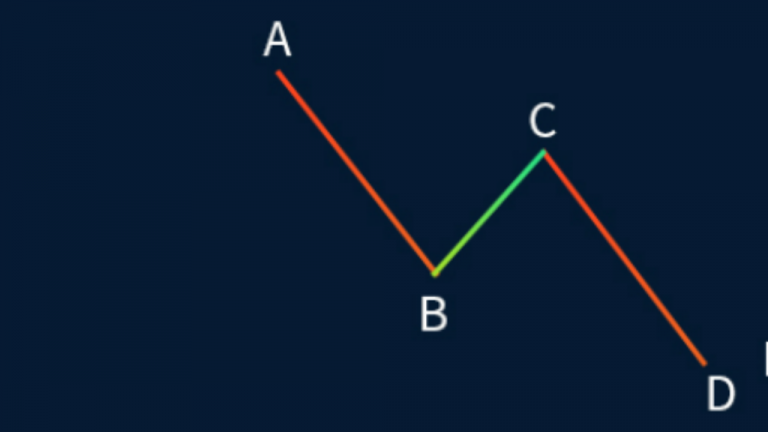
When Is An ABCD Pattern Bearish?
The investor will attempt to sell at point D if the ABCD pattern is bearish. The pattern can be described in the following manner:
A: A is a notable low point.
B: Point B represents a prominent peak. Similar to the bullish ABCD but functioning in the opposite direction, the AB leg cannot contain any points lower than A or higher than B.

C: Point A must be higher than Point C. Again, the BC leg cannot have any highs above B and no lows below C.
D: Point B must be higher than point D. In the CD leg, there cannot be any points lower than C or higher than D. When the CD leg equals the AB leg, the investor will sell.
How to Scan For ABCD Patterns?
Intraday momentum is the optimal method for scanning for ABCD patterns. Immediately after the market begins, many equities have upward or downward trends. The high/low scanner provided by your brokerage or charting software is one of the most effective ways to find this. If you are monitoring this scanner and observe that a particular stock is going up or down and reaching new highs, you should pay attention.
After adding a stock that is achieving new highs on a substantial volume to your watchlist, you will need to monitor it for pullbacks. Depending on your chosen ABCD pattern technique, you will need to monitor it closely. If you decide to purchase the pullback for a scalp to D, you must be mindful of your moving averages and support. Alternatively, if you choose to trade the conventional pattern by shorting at D, you will still need to monitor the stock.
Identify any pivot points, Fibonacci levels, or vwap boulevard lines that could provide a confluence area to bolster your short thesis as you monitor the stock. The more evidence you have to support your trade, the better.
How to Use The ABCD Pattern in Trading?
Step 1: Examine All Indicators
ABCD represents the intraday pattern. Consequently, you must also analyze the multi-day chart.
Ignore the stock if there is a great deal of resistance above it or if it has one-day reversals.
Before entering a trade, you must have all of your ducks in a row. I know I say this repeatedly, but it bears repeating. Perform research beforehand.
If the stock has broken past multi-year resistance and the multi-day chart indicates that it can maintain its gains, then it is probably tradeable.

Volume is another important indicator to consider. After price, this is the second most important indicator, and the stock must have substantial trading volume.
Additionally, it is great if the stock is in a hot industry, has a low float, and has news to boot. Sometimes, a blazingly hot sector is all it takes to propel a stock through a good ABCD pattern.
Step 2: Patience Rewarding
Imagine witnessing a stock surge and then continuing to climb without your intervention. Can you sense the growing frustration and FOMO?
You must understand that this will occur… And be comfortable with losing the trade.
It is not a strategy to pursue. A stock that continues to climb throughout the day is not an ABCD pattern stock and lacks the necessary risk clarity. So be patient.
It is difficult to pass up a play because it does not fit all of your standards. However, keep in mind that the more selective you are, the greater your chances.
Step 3: Set Alerts
If you do not have the time to monitor the market all day, alerts can be a big help. Or they can assist in resisting the desire to jump the gun.
Set an alert for the afternoon when the stock approaches the top of the A leg. This allows you to be prepared for breakouts without constantly monitoring the market.
Then, check back in the afternoon, about 1 p.m., to see if the stock has begun to climb again.
In StocksToTrade, it’s simple to set price alerts. Combine this with attractive charts and robust scanners, and it’s easy to see why so many of the world’s best traders adore it. Traders have created it for traders.
Step 4: Enter Trade
Here is where you trade.
Your entry should normally be C when the stock breaks the high of the day in the afternoon.
Be sure to employ effective risk management.
Step 5: Stick to Your Plan
Consider both the gain and the loss.
If the stock exceeds your risk threshold, sell immediately. Prepare yourself for this possibility. No changing your stop and no holding out hope. Simply trim and move on. In the near future, another ABCD pattern will emerge.
Attempt to sell with a risk-to-reward ratio of at least 2:1 if the stock rises over the day’s high. Sell into strength, or the stock may reverse direction when it appears.
If the stock appears to be extremely strong, you could sell half of your position at your price goal and let the rest run.
If you trade penny stocks, keep in mind that these are not quality companies. To succeed in trading penny stocks, you must sell during the afternoon rally and avoid being greedy.
How To Draw The ABCD Pattern?
Each letter in the ABCD pattern corresponds to a notable high or low in the stock graph, making it relatively simple to identify and follow. Typically, each pattern leg (from one letter to the next) falls between 3 and 13 bars/candles. If the range of bars is narrower, the investor should examine a longer time period to identify the pattern.
After locating the pattern, the Fibonacci retracement tool is utilized to create the legs between the various locations (A to D). This tool identifies the support and resistance zones of the bullish and bearish turns and measures the legs, so aiding in the outcome prediction. It also indicates when investors should buy and sell. An investor can use this tool to predict where the new lows and highs will occur and invest accordingly, given that the AB leg should be the same length as the CD leg.
Common ABCD Pattern Trading Errors
ABCD pattern trading’s greatest risk is recognizing an ABCD pattern where none exists. Active equities exposed to huge fluctuations over a short period of time may exhibit ABCD pattern indicators. Despite the trending nature of these stocks, it might be tough to find support levels.
Volume should also be considered when searching for ABCD patterns. As the pattern is emerging (thus the action), volume tends to be strong and then consolidates as the trend reaches its conclusion. Low volume during the formation of a pattern is a red flag. The pattern may not be the product of the typical trading activity, and it could be due to external circumstances that make the system more volatile than anticipated.
Trading Tips For The ABCD Pattern
Each ABCD pattern has a bullish and a bearish counterpart. As illustrated in the preceding diagram, an ascending ABCD pattern is bearish, but a descending ABCD pattern is bullish.
In all circumstances, the lines AB and CD are referred to as the legs, while BC is called the retracement or correction.
While there are numerous ways to apply entry and exit strategies for stocks, there are a number of considerations traders must make when employing the ABCD pattern.
Entry point
To determine a possible short entry point with the bearish pattern, monitor your scanner as the stock climbs from A and reaches a new intraday high (B). Then, observe whether the price establishes a higher support level than point A, and label this new support level C if it does.
At this point, you should observe while the price consolidates. If support is established at C, then anticipate a fresh high at D. Your short entry will occur when prices begin to retreat from the new high, with a stop placed above the high.
The converse would be true for the bullish ABCD formation.
Exit point
Ideally, you desire a reward-to-risk ratio of 2:1. Therefore, if your stop is 10 cents from your entrance, you would like to generate a profit of at least 20 cents or more.
This can vary for each setup based on the time length and amount of risk involved. For the bearish formation, you want it to reach at least C or lower, and for the bullish pattern, you want it to reach C or higher.
Low volume on consolidation
Similar to most other types of technical analysis, the ABCD pattern is most effective when combined with other chart patterns or technical indicators. Assuming you already know that stocks tend to consolidate fast following a trend, you may wish to examine volume when employing this pattern to confirm a reversal after the pattern makes a prediction.
Volume is the total number of shares of stock that are traded within a specific time period (e.g., daily, weekly, monthly). It indicates the strength of the stock, the quality of a price trend, and the liquidity of the stock.

While the stock is consolidating, volume is typically low, and you should consider this a red flag when employing this pattern.
High volume on the breakout
Once a very clear buy signal has been discovered on your chart, all that remains is to watch for a breakout. If price and volume both break out at the same moment, this is a considerably more significant indication than a price breakout with low volume.
How To Avoid Heavy Losses With The ABCD Pattern
The ABCD pattern highlights the risk and follows a definite pattern; therefore, it should be used as a reference for determining when to sell in order to maximize profits or minimize losses. This trading pattern has existed for a very long time and has therefore been thoroughly examined. Obviously, there will be occasions when an exception to the pattern proves the rule, but it is essential to keep to it in order to avoid substantial losses.
It is also important to consider that the price may rise later in the day. This is another reason why the investor should not risk staying invested when the price falls below the investment point plus the risk value. There is no assurance that the value will rise again; therefore, selling at the optimal point is crucial. If the price begins to rise once more, the investor can simply reinvest later in the hope that this time the stock will reach its objective and become profitable. This strategy eliminates the risk of substantial losses and, if applicable, provides the possibility to recover minor losses and generate a profit.
The Bottom Line
The ABCD pattern should be a part of any trader’s arsenal of trading patterns and trading methods. It is one of the most identifiable patterns and, if traded correctly, can result in substantial profits.
The conventional abcd pattern is a reversal pattern. When the pattern hits the “D” in the abcd, it is time to enter a trade against the trend. Suppose the trend is up; short the market. If the trend is downward, you buy. As a scalper, there are numerous alternate strategies to trade the ABCD pattern in the direction of the fundamental trend.